Alberta Data Shows Hospitals Strained by Vaccine Injuries
Another hidden gem in the Alberta government data
Journalist Alex Berenson reported on how some charts buried in the Alberta government Covid data revealed a rise in Covid cases and deaths following the first dose of the Covid vaccine campaign. Then Covid aficionado gato malo shared Joel Smalley’s reporting on the same subject.
Now I am reporting on another intriguing piece of evidence in Alberta’s Covid data: hospital capacity.
Everyone knows by now that the Covid vaccines do not prevent, nor really even reduce, Covid transmission. The narrative pushing for vaccination instead has shifted to protecting hospital capacity from being overwhelmed by Covid cases by getting vaccinated. Whether or not the vaccines protect you from being hospitalized is up for debate, but I want to focus on the other part of that equation: is Covid really straining the healthcare system?
Despite what you may have heard about Canada’s healthcare system, it’s actually rather abysmal. Canada somewhat infamously has insane wait times for ambulance response and the ER, not to mention pitiful hospital bed and ICU capacity per capita. If Canada’s healthcare system isn’t strained by Covid, it’s safe to say no developed country’s is.

Alberta Healthcare Capacity
The Alberta government is kind enough to provide a useful graphic illustrating their healthcare capacity throughout the course of the pandemic:
https://www.alberta.ca/stats/covid-19-alberta-statistics.htm#healthcare-capacity
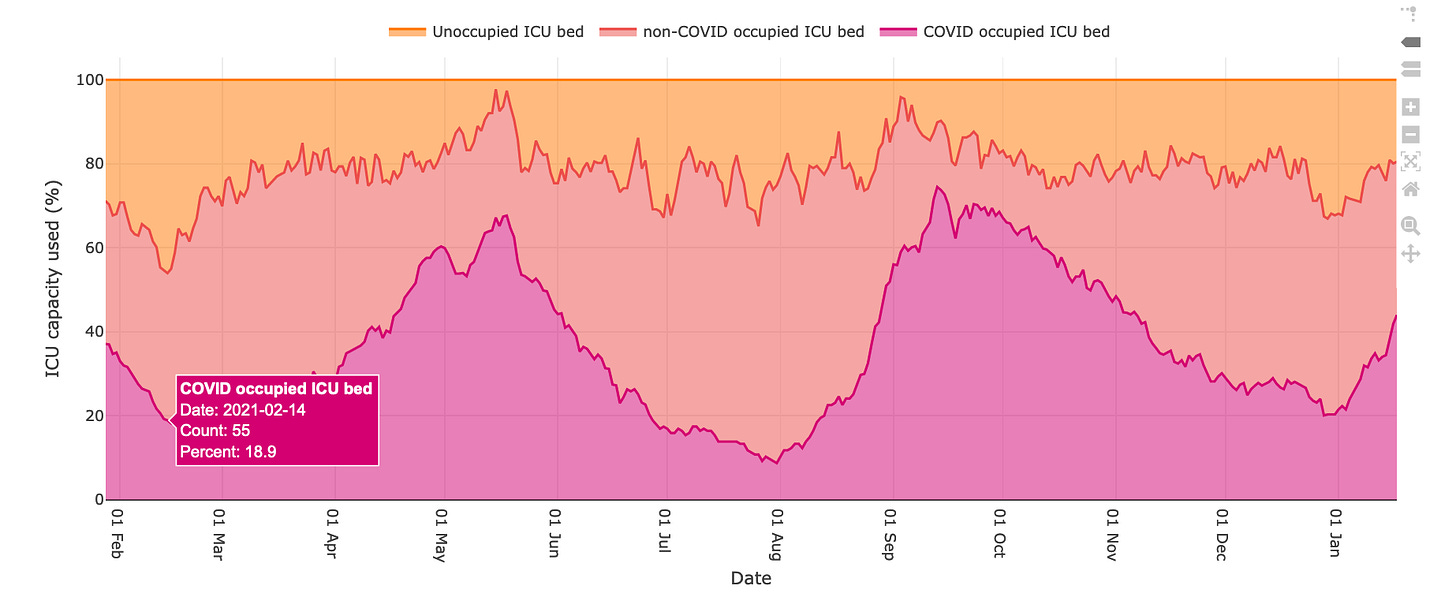
Here is the graph as of today, January 21, 2022:
Take a moment to review this graph. Absorb what each shaded region represents, and how each has changed from January 28, 2021 (far left) to today.
Now, it’s clear that the number of Covid occupied ICU beds (purple) has gone up and down rather dramatically throughout the past year, and these are the numbers that are often referred to when justifying vaccine mandates and the like. In fact, there have been several articles written about how the hospitals would not be strained if everyone would just get vaccinated. Example here:
But the graph from Alberta tells a different story. Look at what happens as Covid ICU cases (purple) goes up. Non-Covid ICU cases (salmon) goes down (ie band gets narrower), and unoccupied ICU beds (orange band) only changes slightly. If Covid ICU cases are going up, it should not “take away” from the non-Covid ICU cases - they should be independent measures. That these two measures appear to be inversely correlated can only mean one thing: the Covid diagnosis is often incidental.
Many of those people are not in ICU because of Covid. They are in ICU and happen to have Covid.
Let’s use some real numbers to illustrate this. Let’s first look at February 14, 2021 when Covid ICU cases were low.
Here are the numbers:
Covid ICU: 55
Non-Covid ICU: 102
Total ICU: 157
Now let’s compare it to Apr 28, 2021 when Covid ICU cases were high.
Here are those numbers:
Covid ICU: 150
Non-Covid ICU: 50
Total ICU: 200
The number of Covid ICU cases went up by 95 - and this is what the media raises the alarm about. They tell us we need to get vaccinated to reduce the strain on the healthcare system. But wait. The number of non-Covid ICU cases went down by 52, and the total number of ICU beds occupied only increased by 43.
This is an obvious sign that something is amiss. That means of the 95 “extra” people in ICU with Covid, 52 of them were incidental (55%).
The next question becomes, why did the total number of people in ICU go up by 43? Is it truly that people were being hospitalized with Covid, or could it have been something else? Like, say, an experimental treatment with unknown side effects?
Let’s check back in with this graph of healthcare capacity, and put it side by side with the vaccine uptake graph for Alberta to test this hypothesis:
I marked the same date on both graphs so you can line them up temporally. Notice anything?
The first wave of ICU admissions in Alberta correlates perfectly with the rise in vaccine coverage of the first dose. By mid-June when the dose 1 uptake levels off, the ICU admissions fall back down again.
This is another line of evidence, using the government of Alberta’s data, that the Covid ICU admissions are driven by incidental testing and vaccine injuries, rather than people sick with Covid.
Regardless of how many people are actually being admitted to ICU because of Covid, this graph also shows, unequivocally, that many of the people being listed as Covid ICU occupied beds are incidentally diagnosed with Covid, and are actually in the ICU for some other reason. Otherwise, there is no reason why the non-Covid ICU cases would decline by a proportional amount that the Covid ICU cases increases.


malo gato sent me. Gosh, your substack is good work. Especially the 5 questions about Covid.
As someone with naturally aquired immunity, why do I also need 3 shots of a vaccine . . . and yet I am the anti-vax idiot who doesn't understand "The Science"
Coupla quick thoughts:
The AEs should be at least as strong from 2 dose, it seems in other data.
How much does seasonality explain - I think the April-June wave is not lined up with typical pattern but the one after that is.
But the "incidental" signal you found looks solid enough!